After Logging into CYTRIX’s tool you will be referred to the tool’s “Home Page” known as the Dashboard :

In here you can view all the vulnerabilities found, sorted by severity level : “High”, “Medium”, “Low” and “Informative”.
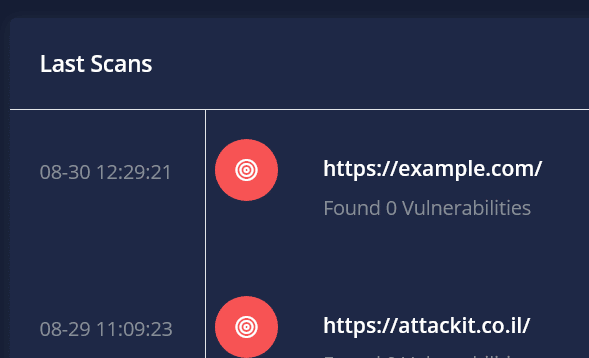
The last two scans performed will appear as follows :
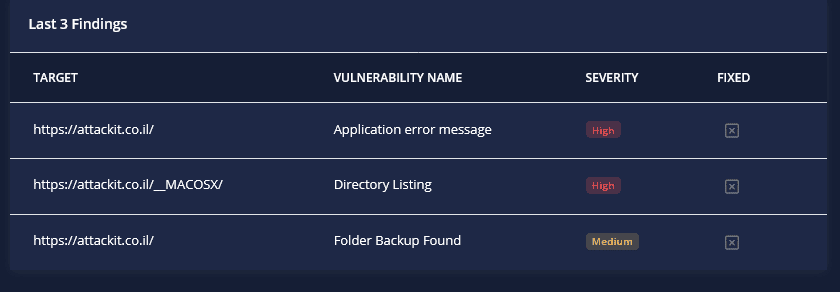
The last three findings (vulnerabilities) found will appear as follows :
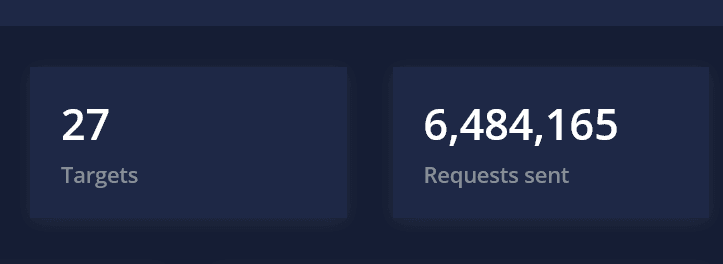
To the right, you can view all the “Targets” indicating the amount of scans performed, and the “Requests” that CYTRIX performed :
You can also Initiate a Quick Scan :

To your left, is the main menu.
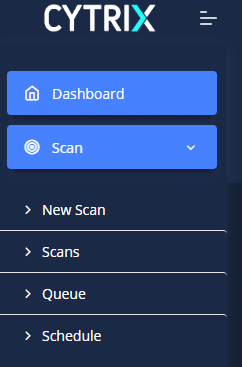
Expanding the “Scan” sub-menu will allow you to start a New Scan (New Scan), view you existing ones (Scans), view your Queued Scans (Queue), and manage your Scheduled Scans (Schedule) :
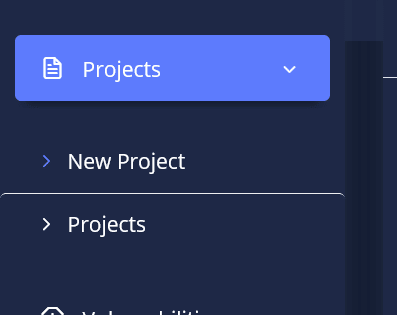
Expanding the “Projects” sub-menu will allow you to view and manage your existing projects (Projects), and, creating new projects (New Project) :
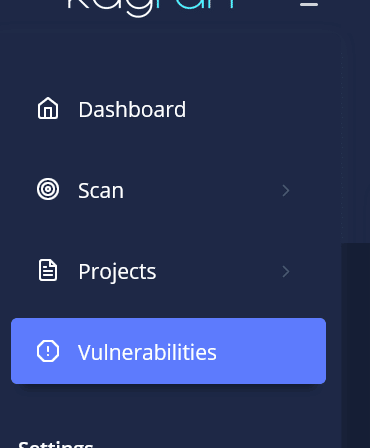
and on the “Vulnerabilities” section you are able to see all the Vulnerabilities CYTRIX detected from all of your scans :
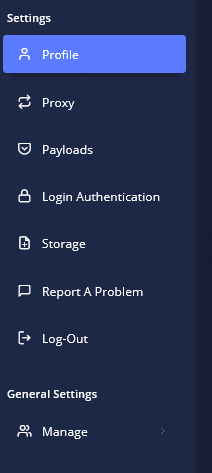
Under Settings, you can manage your Profile (Profile), add\edit Proxies (Proxy), Login Profiles (Login Authentication), Report A Problem (Report A Problem), Using Storage (Storage), Creating New Payloads and Logging-Out :
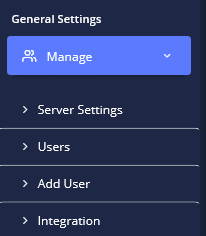
Under “General Settings”, expanding Manage will allow you to Add Users to your Server (Add User), View and Edit all users on your server (Users), Manage your Server Settings (Server Settings) and use Integrations (Integration) :
